Dispersion and probability
|
The
dispersion. However perfectly a gun may
be laying, two successive rounds will never fall in the same place. This means
that even with a correct aim we can never be certain of hitting the target,
there is only the probability to do it. In fact if a number of rounds of
ammunition of the same calibre are fired on the same conditions (position,
charge, aim settings), the trajectories obtained will be different, forming a
bent cone, called “cone of dispersion”. This phenomenon is called dispersion
and, irrespective of human and constant error, is caused by inherent factors
: muzzle velocity, angle of departure and air resistance. The distribution of
bursts is roughly elliptical in relation to the line of fire. |
|
|
Firing a great
number of rounds from gun at a given mark, we obtain the vertical pattern of
the round that had hit the target. Observing their position, we find that they
are not uniformly distributed over the ground, but lie more thickly towards
the centre of the space. This point is called “mean point of impact”.
Starting from this point the thickness of the rounds decreases gradually
until only isolated rounds can be found. The greater is the dispersion the
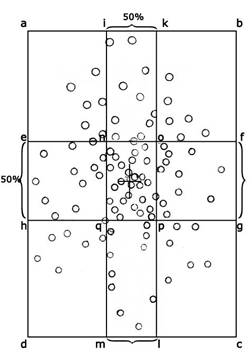
less is the probability to hit the target. Drawing at the
same distance from the main point of impact two horizontal lines ef and hg containing half of the rounds, we obtain a strip, whose width
is called “mean vertical dispersion”. Similarly drawing at the same distance
from the main point of impact two vertical lines im and kl containing
half of the rounds, we obtain another strip, whose width is called “mean
longitudinal dispersion”. The rectangle abcd contains all the rounds fired;
50% of the rounds are in the strip efgh,
and the remaining 50% are above and below that strip, 25% in each of the
strips abef and hgdc. The same happens breadthways.
The area nopq, although is only 1/16
of the total rectangle, contains 25% of the rounds. |
|
|
The calculus of probabilities. The artillery
doctrine of late 1800 assigned great importance to the determination of the
chances to hit the target. The theory of probability demonstrated that the
cone of dispersion, seemingly irregular, was in fact subject to definite
laws, provided that the number of the rounds fired was great enough. Every
ratio between the width of a strip and the mean vertical dispersion
(probability factor), corresponded to a certain number of rounds out of 100.
With the aid of the table of probability factors, it was easy to find the
number of rounds required to hit a target having a certain height, assuming
that the point of impact was in the middle of the target. It was enough to
find the probability factor and look for the corresponding number of rounds. For instance, firing with a 87mm field gun at The
probability factor calculated theoretically with the table and the size of
the target was called “change of hitting the target”, whereas the “actual
change of hitting the target” was the factor esteemed in the field, when many
other factors might intervene (the mean point of impact was not in the middle
of the target, the level of the gun wheels was different, the dispersion was
greater). |
|
|
Table of probability factors |
|||||||
|
% |
factor |
% |
factor |
% |
factor |
% |
factor |
|
1 2 3 4 5 |
0.02 0.04 0.06 0.07 0.09 |
26 27 28 29 30 |
0.49 0.51 0.53 0.55 0.57 |
51 52 53 54 55 |
1.02 1.04 1.07 1.09 1.12 |
76 77 78 79 80 |
1.74 1.78 1.82 1.86 1.90 |
|
6 7 8 9 0 |
0.11 0.13 0.15 0.17 0.18 |
31 32 33 34 35 |
0.59 0.61 0.63 0.65 0.67 |
56 57 58 59 60 |
1.14 1.17 1.19 1.22 1.25 |
81 82 83 84 85 |
1.94 1.98 2.03 2.08 2.13 |
|
11 12 13 14 15 |
0.20 0.22 0.24 0.26 0.28 |
31 32 33 34 35 |
0.70 0.72 0.74 0.76 0.78 |
61 62 63 64 65 |
1.27 1.30 1.33 1.36 1.39 |
86 87 88 89 90 |
2.18 2.24 2.30 2.37 2.44 |
|
16 17 18 19 20 |
0.30 0.32 0.34 0.36 0.38 |
36 37 38 39 40 |
0.80 0.82 0.84 0.86 0.89 |
66 67 68 69 70 |
1.42 1.45 1.48 1.51 1.54 |
91 92 93 94 95 |
2.52 2.60 2.69 2.78 2.91 |
|
31 32 33 34 35 |
0.40 0.41 0.43 0.45 0.47 |
41 42 43 44 45 |
0.91 0.93 0.95 0.98 1.00 |
71 72 73 74 75 |
1.57 1.60 1.64 1.67 1.71 |
96 97 98 99 |
3.04 3.22 3.45 3.82 |
|
|
|||||||
|
Source : ROHNE : Le tir
de l’artillerie de campagne… p. 343. |
|||||||